The results you’ve been waiting for.
About the Biosensor.
Our first results: in silico analysis
Due to the pandemic, we weren’t able to perform any Lab Work in the first months. However, we found a way to begin to test our project through analysis in silico. From the protein we designed in part BBa_K3809010, we wanted to test if there would be a correct folding of the receptor, even after all the modifications and features we added. Furthermore, we wanted to verify that the His Tag we added and the Linker sequence would be exposed enough for us to perform an efficient purification and an adequate immobilization. We tested this through the prediction of a protein model made using the Software Robetta [1]. We took the best model and verified the exposure of the features we added. To test if the folding was being done correctly, the protein was structurally aligned with the crystallized structure of the Human Estrogen Receptor Alpha used as reference, with a PDB code 2IOG (Protein Data Bank) [2]. What we found is that there was a correct folding of the modified protein, sustained by the fact that the structure was quite similar to that of protein 2IOG.
Figure 1.
Protein designed by iGEM Teces. It includes the whole receptor hER⍺ (red), a linker sequence (green), a His Tag (magenta) and a Signal Peptide Sequence (blue). It can be seen that both the linker sequence and the His Tag are exposed. Protein visualized with Chimera [3].


Figure 2.
Structural alignment between the protein designed by iGEM TecCEM (red, magenta, blue and green) and the crystallized structure of the Human Estrogen Receptor Alpha 2IOG (white). The alignment shows a preserved structure in the Ligand Binding Domain of the modified ESR1. Protein visualized with Chimera [3].
The same was done for part BBa_K3809011, which was a reporter we designed to test experimentally in the lab whether the protein was folding correctly and if it could be immobilized in the QCM. The results we got from the alignment of the modified mRFP of BBa_K3809011 and mRFP were the same as for ESR1 of part BBa_K3809010; both retained a similar structure to their reference structures.
To further prove the functionality of our protein, we conducted a Docking Analysis in which we tested the ability of the receptor to bind and capture a group of Endocrine Disruptive Chemicals which includes Estradiol (the natural ligand), Benzene, Bisphenol A, Dimethyl Phthalate, Ethylene Glycol, Phenol, Chloroprene and Perfluorooctanoic Acid. To prepare the model for the analysis, we added hydrogens to it, improving the quality of the assay. To this end, we used the tool MolProbity [4]. The ligands were obtained from PubChem [5] and the Docking was conducted using the Software tool SwissDock [6]. The results we obtained were then visualized in Chimera in search of the type of interaction the ligands had with the receptor. We found that in most cases, the ligands bound to the protein formed a canal instead of a pocket. Besides, from the best result of the docking, we obtained its Free Gibbs Energy and used it to calculate the Association Constant. Furthermore, we evaluated the formation of hydrogen bonds between the receptor and the small molecule. The results are seen below.
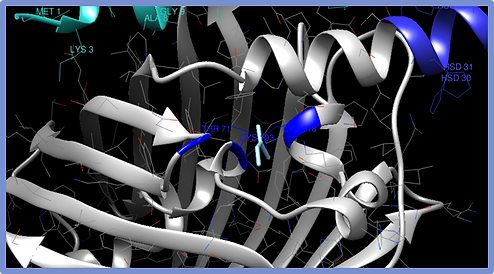
Figure 3.
Chloroprene-ESR1 Complex. The amino acids Thr71, Cys103 and Lys118 act as a spatial reference and are the ones closest to the molecule.
Figure 4.
Chloroprene-ESR1 Complex. The surface of the protein is shown. It was the only ligand that had a pocket interaction.
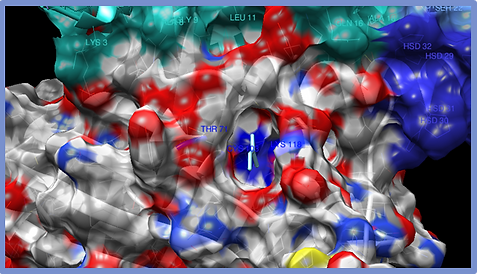
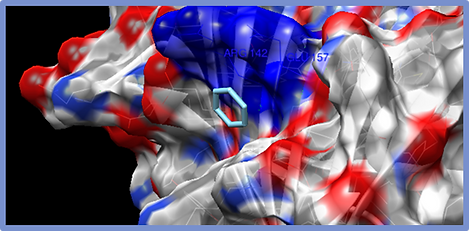
Figure 5.
Benzene-ESR1 Complex. The amino acids that interact with the molecule are mostly Arg142 and Glu157. The surface of the protein is shown and the type of interaction is the formation of a canal.
Figure 6.
Estradiol-ESR1 Complex. The interaction is given by aminoacids Glu65, Thr76 and Leu77. The surface of the protein is shown and the type of interaction is the formation of a canal.


Table I.
Results obtained from the Docking Analysis. Estradiol (highlighted) is the natural ligand of the receptor.
The conclusion we got from these results was that our protein retained its functionality while keeping the characteristics we added and without compromising the affinity towards the ligands. As shown in Table I, we observed that EDCs had a similar affinity towards the receptor as Estradiol (natural ligand); and although the site of the interaction varied, the binding of the ligands with ESR1 was acceptable. What we concluded from this part of the experiments we performed is that we had reasons to believe that ESR1 would be able to work as the capturing molecule of EDCs.
What did we accomplish in the Lab?
After we did the first analysis of the protein, we knew that we had what’s necessary to begin working in the Laboratory. We had gathered enough information and had the material in the Lab just to begin our experiments. So, after we got our permission to enter our Campus, we did just that.
We planned our experiments as follows:
-
Obtain our Biobricks (either from the Synthesis of gBlocks through IDT or retrieving them from past iGEM plates).
-
Insert our gBlocks in pSB1C3 vectors.
-
Transform our DNA in a Cloning System to get more copies.
-
Extract the plasmids out of the Cloning System.
-
Make digestions of the plasmids containing the Biobricks.
-
Ligate our Biobricks with the ones we obtained from iGEM plates.
-
Transform our constructs in a Cloning System to get more copies.
-
Extract the constructs out of the Cloning System.
-
Transform our constructs in an Expression System.
-
Retrieve our protein
-
Immobilize the protein onto the Quartz Crystal Microbalance.
The parts we synthesized from IDT were BBa_K3809010 and BBa_K3809011 while the part we retrieved from iGEM Plates was BBa_K081005. We assembled parts BBa_K3809012 (ESR1) and BBa_K3809013 (mRFP) by merging BBa_K3809010 with BBa_K081005 and BBa_K3809011 with BBa_K081005 respectively. For more information about our Parts, read here.
However, due to the pandemic we were unable to achieve the goal of the protein purification and the subsequent immobilization onto the QCM. However, we did plan the immobilization protocol. It consists of the immobilization using the cysteine residue we added to the protein and a functionalized QCM. The functionalization would be done using L-cysteine, genipine and chitosan and the formation of a crosslinked structure that would give the protein stability.

pSB1C3, mRFP and ESR1
We started out by observing the plasmids pSB1C3 we had on an agarose gel electrophoresis to determine with which one was going to work.
We chose plasmid pSB1C3 labelled as B (lane 8), as it presented the clearest band between 2 and 3 Kb on the gel.
Next, we transformed 3 DH5a cultures with chosen pSB1C3 plasmid, made an extraction and ran an agarose gel electrophoresis to verify integrity and desired size.
We noted clear bands of approximately 2 kb. pSB1C3 desired plasmid is 2070 kb, so we were able to verify its size.

Next, a digestion with restriction enzymes EcoRI and PstI was carried out to make sure those enzymes cut the plasmid at the desired sites, producing expected fragment sizes.
All fragments were the expected size, as well as the uncut plasmid in lane 8.

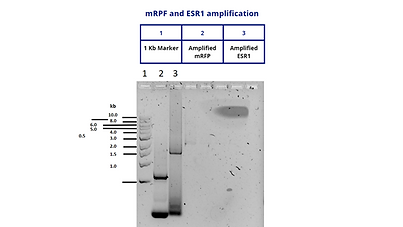
At the same time, we amplified by PCR our mRFP and ESR1 genes in order to obtain multiple copies and be able to clone each one with pSB1C3.
Both amplified products were the desired size. mRFP amplification was expected to be 997 bases and ESR1 amplification was expected to be 1971 bases. Both amplifications are observed in the agarose gel near the desired sizes.
In parallel, DH5a chemocompetent cells were transformed with BBa_K081005 and inoculated in a selective culture medium.
Transformation was successful because the LB+agar+CAM culture medium presented growth, which means the bacteria acquired the CAM resistance gene inside BBa_K081005.

Next, we performed the cloning protocol for pSB1C3 plasmid with mRFP.
One band of approximately 2.5-3 kb can be observed clearly in lanes 8-11. As pSB1C3 is 2070 kb and mRFP is 861 kb, the product of both genes is 2931 kb. With this agarose gel we could confirm that our cloning protocol to build pSB1C3+mRFP was successful.


After that, we performed the cloning protocol for pSB1C3 plasmid with ESR1. We proceeded to DH5a with pSB1C3+mRFP and pSB1C3+ESR1 constructions. Both plasmids were extracted. pSB1C3+mRFP was amplified by PCR and ran in agarose gel electrophoresis and pSB1C3+ESR1 was directly ran in agarose gel electrophoresis.
We observed the desired amplification product size on lanes 2-5, since we expected a 997 base amplicon. We expected a bigger extraction product on lanes 6 and 7, so we think those extracted products were supercoiled, leading to smaller fragments.
Next, a digestion with restriction enzymes SpeI and PstI was carried out to make sure those enzymes cut the plasmid at the desired sites, producing expected fragment sizes.
All fragments were the expected size.


After that, DH5a transformed cells with both constructions (pSB1C3+mRFP and pSB1C3+ESR1) were propagated in culture media (solid and liquid). 30 colonies were chosen from the pSB1C3+ESR1 cultures and a colony PCR was performed to them in order to verify the presence of ESR1. The colonies that present DNA fragments of approximately 2 Kb, since ESR1 is 1971 bases.
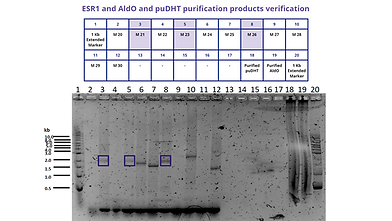
A few colonies of the 30 that were chosen presented the expected size (colonies 8, 13, 18, 21, 23 and 26, as illustrated above), so those DNA fragments were extracted and BL21 cells were transformed with them.
Protein Expression:
Our Final Result
We were able to express the protein only for cells from colonies 18 and 23. The results were verified through an SDS-PAGE. However, the best band was seen for colony 23. The results are shown below.
We retrieved samples during the incubation period so that we could see the differential expression of ESR1.
In conclusion:
The results shown are promising and demonstrate that we can produce this protein in order to immobilize it in our QCM. Due to the pandemic, we weren’t able to do that just yet; but, we want to continue with this project and develop our biosensor so that we can fulfill the implementation we proposed.

This figure shows the band corresponding to the protein ESR1 (69.6 kDa).
The other side of our project: Degradation through a Laccase.
As we stated in our Project Description, one of our goals was to find a Laccase that could degrade EDCs in water. Here we describe how our screening process was done and how we characterized the Laccase and establish a purification protocol.
In silico analysis
For this section of our project, we wanted to compare the Laccase we were using (BBa_K863010) with a Commercial Laccase (if you want to see how we selected this Laccase, please read the information below). We did some experiments in which we predicted the structure of the enzyme to test the affinity of the Laccase towards any given substrate through Molecular Docking. We uploaded the amino acids sequence of the enzyme to I-TASSER, a server which runs a platform that predicts the structure of a protein and its function through a model [7] and compared the model we got with a Laccase from Trametes versicolor obtained from PDB under the code 1KYA [8] using a structural alignment (seen in figure 9).
Figure 9.
Structural alignment of the model of the Laccase from BBa_K863010 predicted using I-TASSER (Light Brown) and the Laccase 1KYA from Trametes versicolor obtained from PDB (Light Blue). Image visualized using Chimera [3].
The results of these experiments showed a similar folding to the Laccase 1KYA from Trametes versicolor, which makes us think that the affinity for their substrates may be also similar. To test whether this last statement was true, we performed a Docking using SwissDock [6] and obtained the Free Gibbs Energy of the interaction, as well as the Affinity Constant for a group of EDCs (the same group we used for the Docking of ESR1). The Docking was done for the Modeled Protein and the Laccase 1KYA.
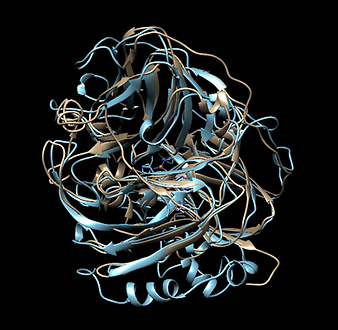
Table II
Results obtained from the Docking Analysis for Laccase from BBa_K863010
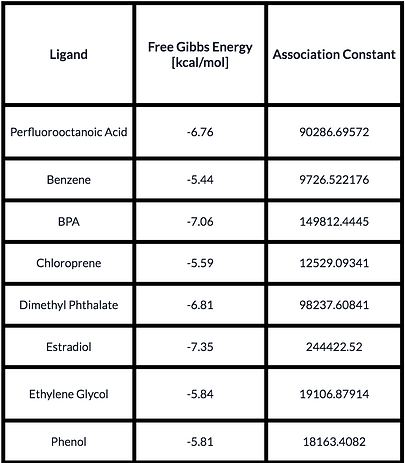
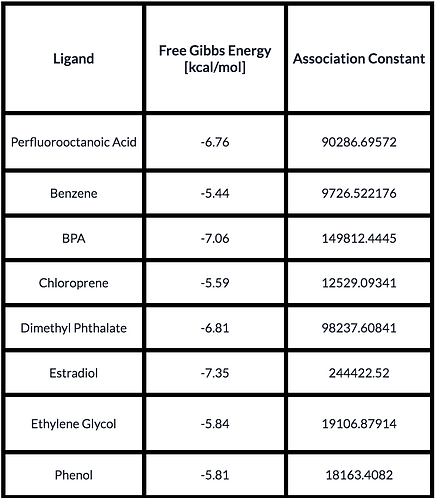
Table III
Results obtained from the Docking Analysis for Laccase from Trametes versicolor.
In this case, the results were similar between both Laccases, with a similar affinity towards the same substrates.
Color Assay:
To test if our Laccase had activity and could degrade EDCs, we performed a colorimetric assay using methylene blue, rose bengal and malachite green as substrates. We based the assay on several experiments that used these colorants to indicate the presence of a Laccase producing organism in agar plates [9].
Selecting our Laccase:
The following table describes the four laccases with which we started our experiments. At first we carried out the assays described next to characterize each laccase and deduce which one works best.
We used three colorants (methylene blue, malachite green and bengal rose) at the beginning of our experimentation to verify laccase functionality. We observed the color changes in each colorant when interacting with the pellet (soluble fraction) and with the supernatant (culture medium) of the BL21 LB+CAM culture with which we expressed the laccases.


Citrate Buffer With Colorants - August 18
No apparent difference between the RIPA buffer control and laccase B pellet laccase is found. The rest of the pellet tubes and all the supernatant tubes do present color differences compared to their controls. This suggests that the laccases A, C and D present functionality when they are and they are not secreted by the cells, and laccase B presents functionality only when it is not secreted by the cells.
All tubes do present color differences compared to their controls. This suggests that the four laccases present functionality when they are and they are not secreted by the cells.
References:
[1] N. Kalogerakis et al., “Microplastics Generation: Onset of Fragmentation of Polyethylene Films in Marine Environment Mesocosms”, Frontiers in Marine Science, vol 4, bl 84, 2017.
[2] N. Expósito, J. Rovira, J. Sierra, J. Folch, en M. Schuhmacher, “Microplastics levels, size, morphology and composition in marine water, sediments and sand beaches. Case study of Tarragona coast (western Mediterranean)”, Science of The Total Environment, vol 786, bl 147453, 2021.
[3] Hormone Health. "Endocrine Disrupting Chemicals EDCs", Health tools for patients and caregivers provided by Endocrine Society, 5-10, 2018.
[4] M. Wagner en J. Oehlmann, “Endocrine disruptors in bottled mineral water: total estrogenic burden and migration from plastic bottles”, Environmental Science and Pollution Research, vol 16, no 3, bll 278–286, Mei 2009.
[5] L. Sax, “Polyethylene terephthalate may yield endocrine disruptors”, Environmental health perspectives, vol 118, no 4, bll 445–448, Apr 2010.
[6] H. Geyer et al., “Bioaccumulation and Occurrence of Endocrine-Disrupting Chemicals (EDCs), Persistent Organic Pollutants (POPs), and Other Organic Compounds in Fish and Other Organisms Including Humans”, vol 2, 2007, bll 1–166.
[7] H.-S. Chang, K.-H. Choo, B. Lee, en S.-J. Choi, “The methods of identification, analysis, and removal of endocrine disrupting compounds (EDCs) in water”, Journal of Hazardous Materials, vol 172, no 1, bll 1–12, Des 2009.
[8] A. Bezbaruah en H. Kalita, “Sensors and Biosensors for Endocrine Disrupting Chemicals: State-of-the-Art and Future Trends”, Treatment of Micropollutants in Water and Wastewater, Jan 2010.
[9] M. Murata, C. Gouda, K. Yano, S. Kuroki, T. Suzutani, en Y. Katayama, “Piezo electric sensor for endocrine-disrupting chemicals using receptor-co-factor interaction”, Anal Sci, vol 19, no 10, bll 1355–1357, Oct 2003.
[10] K. S. Carmon, R. E. Baltus, en L. A. Luck, “A biosensor for estrogenic substances using the quartz crystal microbalance”, Anal Biochem, vol 345, no 2, bll 277–283, Okt 2005.
[11] BioRender. Diagram created with BioRender. https://biorender.com/
[12] K. D. Dykstra et al., “Estrogen receptor ligands. Part 16: 2-Aryl indoles as highly subtype selective ligands for ERα”, Bioorganic & Medicinal Chemistry Letters, vol 17, no 8, bll 2322–2328, 2007.
[13] K. Ekena, K. E. Weis, J. A. Katzenellenbogen, en B. S. Katzenellenbogen, “Different residues of the human estrogen receptor are involved in the recognition of structurally diverse estrogens and antiestrogens”, J Biol Chem, vol 272, no 8, bll 5069–5075, Feb 1997.
[14] G. Vandermeulen, C. Marie, D. Scherman, en V. Préat, “New generation of plasmid backbones devoid of antibiotic resistance marker for gene therapy trials”, Mol Ther, vol 19, no 11, bll 1942–1949, Aug 2011.
[15] S. Lindner et al., “A synthetic glycerol assimilation pathway demonstrates biochemical constraints of cellular metabolism”, The FEBS Journal, vol 287, 08 2019.